- ActionTiles Forum
- Panels (dashboards)
- Event History
-
 Ideas & Feature Requests

+29
Deferred: Voting Open
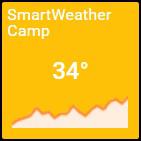
Allow "sparklines" (miniature line-graphs) on Tiles to track/trend data like temperature
Tamathumper 9 years ago
in Panels (dashboards) / Event History
•
updated by Terry (ActionTiles) (Co-Founder) 9 years ago •
2
• 1 duplicate
Would it be possible to display a simple sparkline graph on select Tiles, so we could get a quick visual of variables over time, like temperature, humidity, lux, or even binary variables like open/close, or motion/no motion? https://en.wikipedia.org/wiki/Sparkline This would save me from having to use InitialState or stream my events into Google Sheets to get charts.
Something like this (bad) mockup...
Duplicates
1
Commenting disabled
Customer support service by UserEcho

Event History (and the many variations and features that it can lead to...) is a area that we expect to explore adding to ActionTiles. ... In fact, we already have a Forum Category for this 😊; which I've put this Topic into.
As for the forms that Event History can be displayed or depicted; I like this "sparkline" idea, though I have no idea how difficult it would be to implement within our current framework.
This is far enough off of our radar that I'm going to mark the Topic as "Deferred" for now. It can still collect Topic Votes, which may help us bring it forward from the back burner.
Thanks for idea!
...Terry.
Hi Markus,
This is not a super popular request yet, but we're aware that various other smart home platforms offer this built-into their Apps (Fibraro, I think?)... So we certainly see the potential value.
This is a duplicate request, however, so I've merged it, in order to optimize voting.
Thanks!
...Terry.