- ActionTiles Forum
- Panels (dashboards)
- Event History
-
 Ideas & Feature Requests

Report or display timestamp of last Event for sensors, etc.
I don't need a full event history, but I would like to see a timestamp for the last event. Specifically, the last event for motion sensors and presence sensors.
Answer

I'd like to see this for all Things - basically timestamp of last state change or the elapsed time. Ideally this would be configurable so you can choose what tiles you want it on and timestamp versus elapsed.

Be sure to see and Vote on this related Topic too: http://support.actiontiles.com/topics/1126-activity-event-history-for-things-tiles-and-panels/

Voted, I would like this as well. On some tiles it might just fit at the bottom, replace the battery for example. When batteries are close to 0%, it is obviously good to know, but I personally don't need to see "battery 100%" every day. I would prefer to see last change timestamp at the bottom of motion or contact sensor with a a very short text string, like...
1m ago (1 minute ago)
90m ago (90 minutes ago)
2h ago (2 hours ago)
47h ago (47 hours ago)
2d ago (2 days ago)
300d ago (300days ago)
or alternative date and time...
Mo 1700 (Monday 5pm)
7/4 0802 (July 4 8:02am)
I personally find "time ago" format of event reporting to be super annoying; so I'm officially on record against that part of your suggestion 👿.
When I want to see when something happened, my brain grasps absolute time (ie, "Kevin arrived at 10pm" rather than "12.5 hours ago") much easier. Especially if Kevin's curfew is 9pm!
The number of apps and websites that use "ago" time/date displays is incredible. It also leads to arbitrary choices for rounding. eg, After 24 hours, they tend to round to whole days, weeks, ... Again, if a curfew is at 9pm, it doesn't help for me to see you arrived "2 days ago".

Thanks Terry for pointing out this feature request. I'm adding my comments here.
I'd really like an easy way to look at a tile and know that a temperature reading is current. I.E., the sensor has reported recently, so I know for sure I'm not looking at a temperature that was recorded 24 hours ago because the device has stopped communicating. Exact time of the last report makes sense to me, but the concept of tile color that indicates recent communications, or a lack of communications, would be interesting too.
There's certainly limited room on a Tile, so thanks for bringing up some creative suggestions regarding this Idea.
"Age / Timeliness / freshness" of the data value is a bit different than "lack of communications"; The latter concept has been added to the SmartThings platform as "Device Health Check"; but the API for that has still not been exposed to developers like us.
Hopefully, however, ActionTiles will be notified of devices with Health Check issues. It remains to be decided how to indicate this; and how to differentiate an official Health Check notice vs. data value age. Does the age indicator for a data value have to be easily visible? We hesitate to add arbitrary color combinations. A "countdown" bar might be a minimalist way to fit this on a Tile; or the entire concept may only be practical when a method of pulling up Event History is implemented. Lots to think about!

This has been in the back of my mind for quite a while and I found a crude solution... but at least it's forward progress...This is what it looks like in a 3x2 tile:
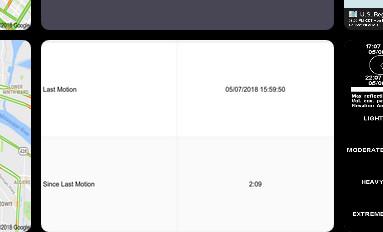
Using Simple Event Logger, I gather the data into google sheets. In a separate sheet, I pull a filter that gets all "motion" data for the past 24 hours and then work from there... If this is your sheet:
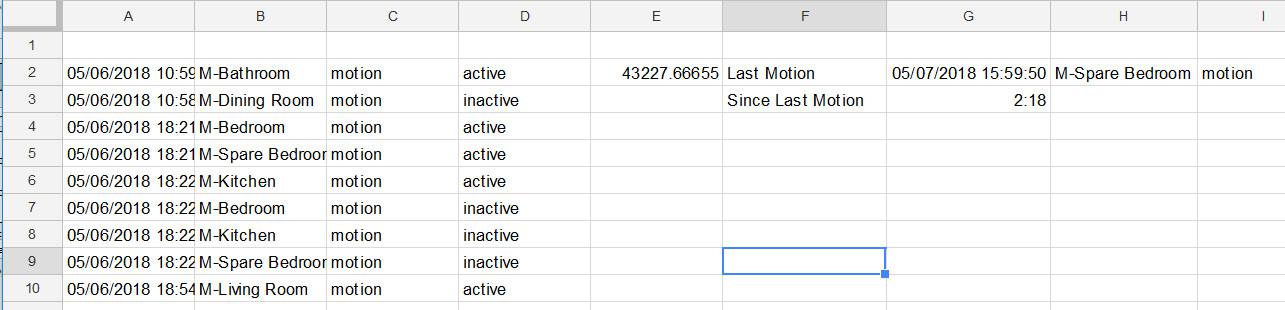
Then the formulas I used are:
A2: =filter(Sheet1!A:D,Sheet1!A:A>now()-1,Sheet1!C:C="Motion")
E2: =max(A:A)
F2: "Last Motion"
F3: "Since Last Motion"
G2: =filter(A:D,A:A=E2)
I then highlighted F2:G3 and inserted a chart.
Chart type: scroll all the way to the bottom and you'll find "Table Chart"
Publish it as an image and use the image in your media... put that media onto your tiles...
I haven't figured out how to customize the text size or colors... but if you click on the tile, it enlarges to a size suitable to read...
Using the same process, I should be able to figure out when any objects were used, IE Last switch that went off, or last person to leave, etc...
Hope this helps someone else sleep at night... I'm no coder, please excuse the rough nature of this solution.
I tried the google table chart but don't like how it looks, would be perfect if they would let us pick colors and fonts for the chart. Let us know if you find anything new :-)
Customer support service by UserEcho

Be sure to see and Vote on this related Topic too: http://support.actiontiles.com/topics/1126-activity-event-history-for-things-tiles-and-panels/