- ActionTiles Forum
- Panels (dashboards)
-
 Ideas & Feature Requests

My first dashboard - really happy but need more config options!
So - started using Action Tiles last week with my Smartthings V3 and a bunch of z-wave, zigbee and Hue devices. Got a panel done yesterday that I am pretty happy with. I am using the brilliant Simple Event Logger
And I have done som modifications of it to get separate columns for the values I want to chart to make that easier and some modding of the Groovy script to get values that work with the darn swedish decimal signs in google sheets (, and not .).
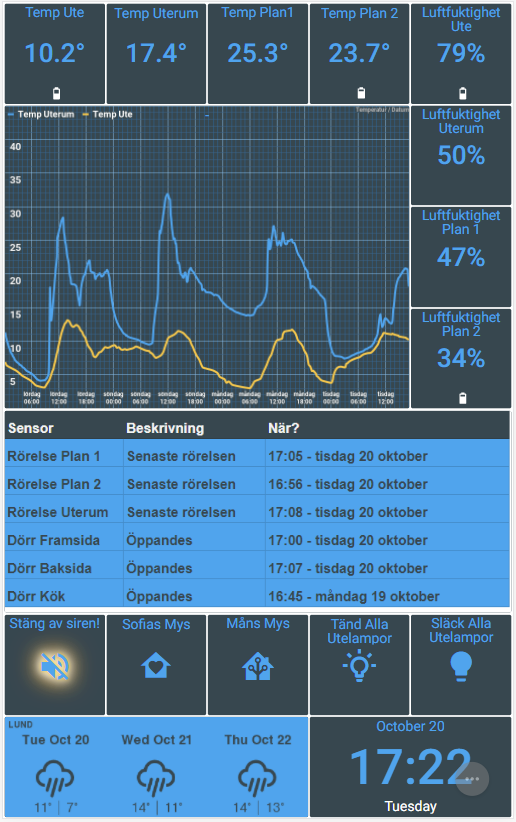
So this is the end result - it's displayed on an old Nexus 7 tablet standing and even my wife likes it ;) One graph from Google Sheets shared as an image and one table shared as an iframe (with a lookup function for the last event for a device - done with a column "device + event" to make it easier to find the last. Realized that getting the chart in exact 4:3 format for the tile is important to avoid resize problems with thin lines disappearing.
So - I am almost happy now, but I have a few proposals after my initial experience:
It really feels like we should have an option to set a special color for the tiles we like to do that for. Just add a background color override on the tile level. Yes, I know that you can fake that for special tiles by forcing them to a "warning state" etc like I have done for the siren in the bottom left row above the weather widget, but that feels like a hack. And it does not work for regular device tiles. Just add background color, text color etc so we can do that for all tiles. It really should not be that hard. In my example I want the outdoor temp color in the top left corner to differ from the others. I want it to have the lighter blue background from the theme, as that really is what you want in the morning quickly glancing at the panel to check if you need the winter coat or not... Maybe add a "Normal Tile Type 2" or similar in the Theme so when then can click a tile and select the Theme "class"?
It would be great to be able to add charts with historic data for devices. I do understand that it can be a bit tricky but even though the Smart Logger hack with a Google spreadsheet chart for full control is nice, it takes some nerd skills.
It would be very nice to add an option for "show last event of type x on the tile" . That is a common thing I want to show at least.
Finally - it would be nice to be able to have the option on iframe objects to remove the scrollbars if desired (overflow: hidden;) As it is now I have been forced to set the iframed google sheets table with "the last events" very exactly to fill the tile space to avoid white background... Why would we like scroll bars in a dashboard like this. Hidden scrollbars really should be the default.
PS swedish translations:
Ute = outdoor
Uterum = conservatory
Rörelse = motion
Plan = floor
Luftfuktighet = humidity
Customer support service by UserEcho

You know, I can see in a layout like what you have there, it would be really nice to have a tile swapping option so if you click on a temperature sensor, it showed the graph for that sensor. Touch a different temperature sensor and it changed the graph to match.
I know how to do that for a standard web page, but not sure how it might be configured simply in the backend for ActionTiles.
Ahh - that would be great!